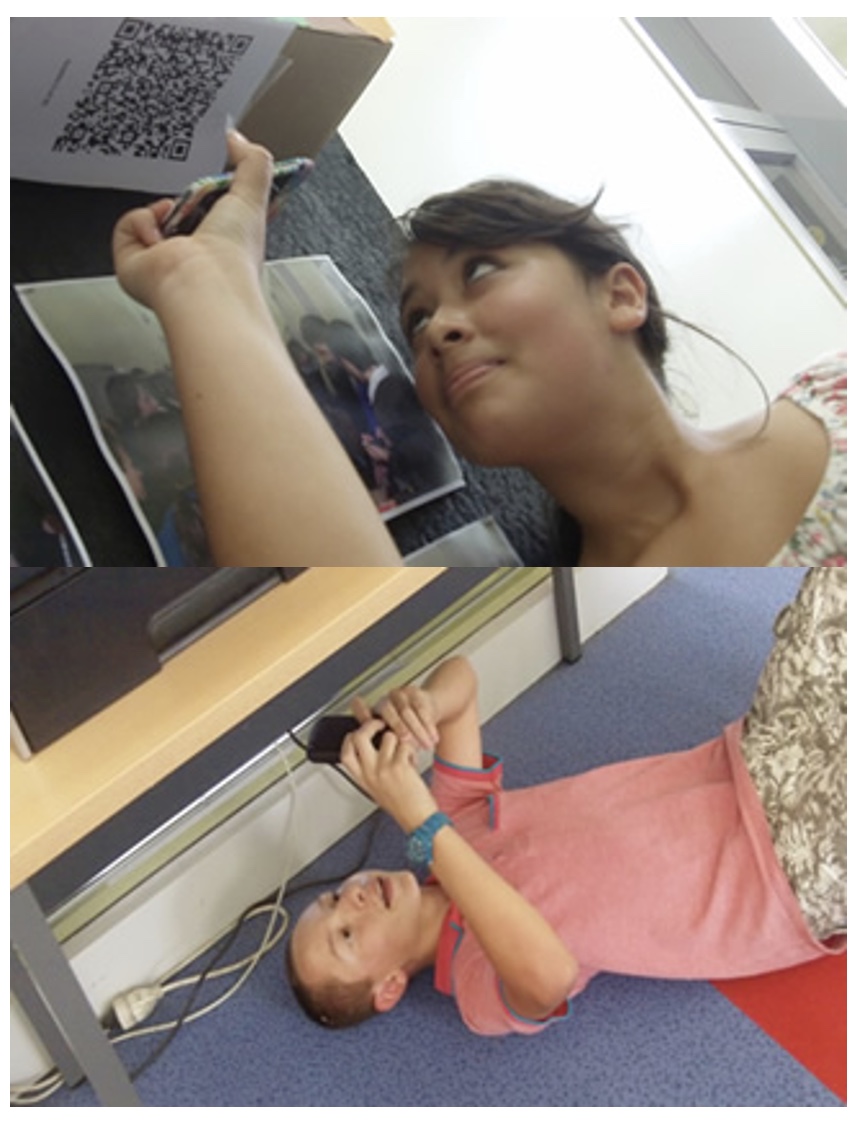
1. Arrange students into groups. Each group needs at least ONE person who has a mobile device.
2. If their phone camera doesn't automatically detect and decode QR codes, ask students to
4. Cut them out and place them around your class / school.
1. Give each group a clipboard and a piece of paper so they can write down the decoded questions and their answers to them.
2. Explain to the students that the codes are hidden around the school. Each team will get ONE point for each question they correctly decode and copy down onto their sheet, and a further TWO points if they can then provide the correct answer and write this down underneath the question.
3. Away they go! The winner is the first team to return with the most correct answers in the time available. This could be within a lesson, or during a lunchbreak, or even over several days!
4. A detailed case study in how to set up a successful QR Scavenger Hunt using this tool can be found here.
Question | Answer |
| 1. At a restaurant, Felix's meal came to $12.95, including tax. He wants to leave a 20% tip. How much should Felix leave? | $2.59 | 2. Which type of graph should you create to show the results of a class survey about students' favorite Thanksgiving food? How do you know? | pie graph - You'd want to show what percent of students' liked yams, green beans... | 3. Find the mean of the data. 85, 70, 68, and 97. | 80 | 4. a = 3 and b = 6 and c = 10 Evaluate. 3c + a | 33 | 5. Write .06 as a decimal in simpliest form. | 3/50 |
![]()
At a restaurant, Felix's meal came to $12.95, including tax. He wants to leave a 20% tip. How much should Felix leave?&choe=UTF-8
Question 1 (of 5)
![]()
Which type of graph should you create to show the results of a class survey about students' favorite Thanksgiving food? How do you know?&choe=UTF-8
Question 2 (of 5)
![]()
Find the mean of the data. 85, 70, 68, and 97.&choe=UTF-8
Question 3 (of 5)
![]()
a = 3 and b = 6 and c = 10 Evaluate. 3c + a&choe=UTF-8
Question 4 (of 5)
![]()
Write .06 as a decimal in simpliest form.&choe=UTF-8
Question 5 (of 5)