![]()
PREMIUM LOGIN
ClassTools Premium membership gives access to all templates, no advertisements, personal branding and many other benefits!
| Username: | ||
| Password: | ||
|
Submit
Cancel
|
||
| Not a member? | ||
![]()
PREMIUM LOGIN
ClassTools Premium membership gives access to all templates, no advertisements, personal branding and many other benefits!
| Username: | ||
| Password: | ||
|
Submit
Cancel
|
||
| Not a member? | ||
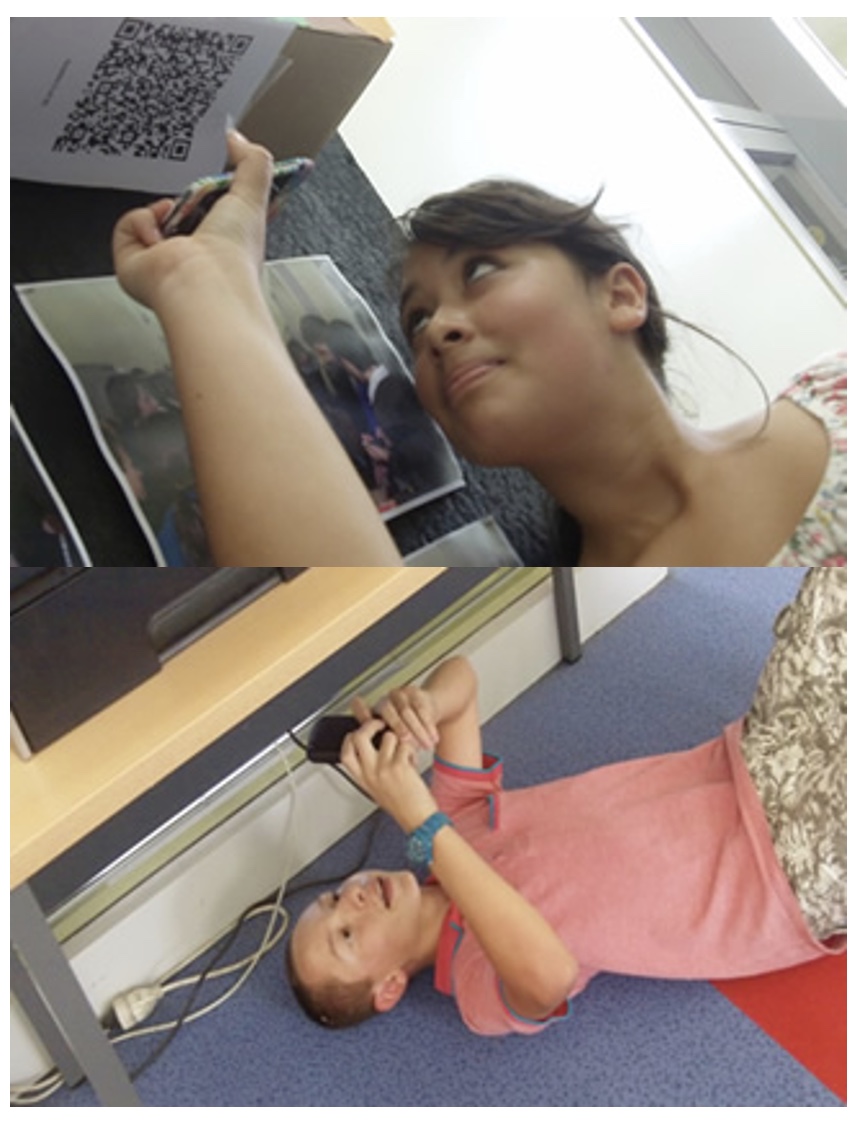
1. Arrange students into groups. Each group needs at least ONE person who has a mobile device.
2. If their phone camera doesn't automatically detect and decode QR codes, ask students to
4. Cut them out and place them around your class / school.
1. Give each group a clipboard and a piece of paper so they can write down the decoded questions and their answers to them.
2. Explain to the students that the codes are hidden around the school. Each team will get ONE point for each question they correctly decode and copy down onto their sheet, and a further TWO points if they can then provide the correct answer and write this down underneath the question.
3. Away they go! The winner is the first team to return with the most correct answers in the time available. This could be within a lesson, or during a lunchbreak, or even over several days!
4. A detailed case study in how to set up a successful QR Scavenger Hunt using this tool can be found here.
Question | Answer |
| 1. The total number of rows and columns | Dimension |
| 2. Visual representations of your ideas | SmartArt Graphics |
| 3. The default chart type | Clustered Column Chart |
| 4. A vertical series of cells in a chart, table, or spreadsheet | Columns |
| 5. The one cell surrounded by a heavy border | Active Cell |
| 6. Assists you in creating a graphic because you can direct your attention to developing and editing the message without being concerned with the actual graphic | Text Pane |
| 7. A rectangular grid containing vertical columns and horizontal rows | Microsoft Excel Worksheet |
| 8. A grid consisting of rows and columns | Table |
| 9. Professionally designed effects that have a variety of shape fills, edges, shadows, line styles, gradients, and three-dimensional styles | SmartArt Style |
| 10. The intersections of rows and columns and they are the locations for the chart data and text labels | Cells |
| 11. The ability to examine and assess images | Visual Literacy |
| 12. A range of cells that go across a table, chart, or spreadsheet horizontally | Rows |
| 13. A box that identifies each slide of the pie chart and coordinates with the colors assigned to the slice categories | Legend |
![]()

Question 1 (of 13)
![]()

Question 2 (of 13)
![]()

Question 3 (of 13)
![]()

Question 4 (of 13)
![]()

Question 5 (of 13)
![]()

Question 6 (of 13)
![]()

Question 7 (of 13)
![]()

Question 8 (of 13)
![]()

Question 9 (of 13)
![]()

Question 10 (of 13)
![]()

Question 11 (of 13)
![]()

Question 12 (of 13)
![]()

Question 13 (of 13)