![]()
PREMIUM LOGIN
ClassTools Premium membership gives access to all templates, no advertisements, personal branding and many other benefits!
| Username: | ||
| Password: | ||
|
Submit
Cancel
|
||
| Not a member? | ||
![]()
PREMIUM LOGIN
ClassTools Premium membership gives access to all templates, no advertisements, personal branding and many other benefits!
| Username: | ||
| Password: | ||
|
Submit
Cancel
|
||
| Not a member? | ||
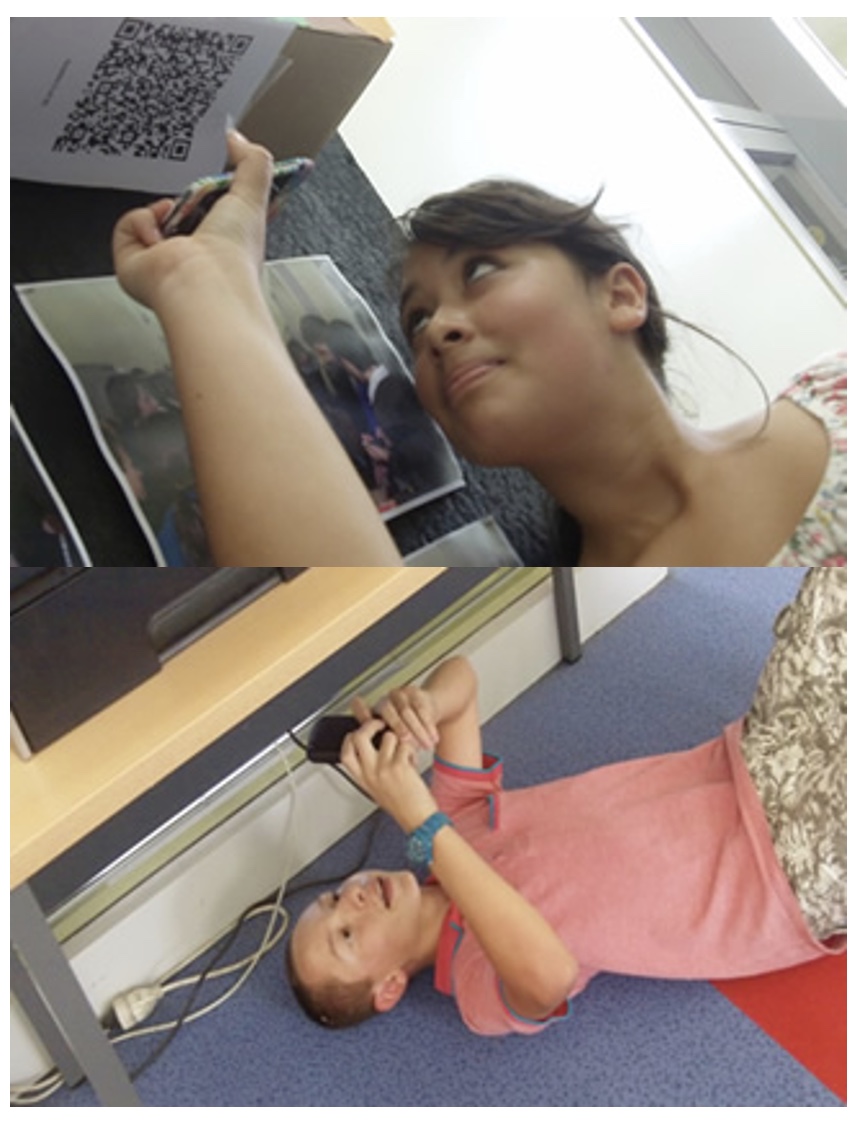
1. Arrange students into groups. Each group needs at least ONE person who has a mobile device.
2. If their phone camera doesn't automatically detect and decode QR codes, ask students to
4. Cut them out and place them around your class / school.
1. Give each group a clipboard and a piece of paper so they can write down the decoded questions and their answers to them.
2. Explain to the students that the codes are hidden around the school. Each team will get ONE point for each question they correctly decode and copy down onto their sheet, and a further TWO points if they can then provide the correct answer and write this down underneath the question.
3. Away they go! The winner is the first team to return with the most correct answers in the time available. This could be within a lesson, or during a lunchbreak, or even over several days!
4. A detailed case study in how to set up a successful QR Scavenger Hunt using this tool can be found here.
Question | Answer |
| 1. # Guitars Sold 12 15 20 8 15 18 17 21 10 24 What is the mean of the number of guitars sold in a given year? | 16 | 2. # Guitars Sold 12 15 20 8 15 18 17 21 10 24 What is the mode of the number of guitars sold in a given year? | 15 | 3. # Guitars Sold 12 15 20 8 15 18 17 21 10 24 What is the median of the number of guitars sold in a given year? | 16 | 4. # Guitars Sold 12 15 20 8 15 18 17 21 10 24 What is the variance of Jesse’s data (one decimal place)? | 22.8 | 5. # Guitars Sold 12 15 20 8 15 18 17 21 10 24 What is the standard deviation of Jesse’s data (one decimal place)? | 4.8 | 6. # Guitars Sold 12 15 20 8 15 18 17 21 10 24 If an outlier is defined as any value that is more than two standard deviations from the mean, which, if any, values in Jesse’s data would be considered an outlier? | None | 7. # Guitars Sold 12 15 20 8 15 18 17 21 10 24 What is the range for the given information? | 16 | 8. # Guitars Sold 12 15 20 8 15 18 17 21 10 24 Draw a bell curve with labels to show the empirical rule used in real-life situations. | N/A | 9. What do you call data that is taken from a specific group that will skew the data one way due to upbringing, prejudice, or own personal views? | bias | 10. What is a type of sample taken where you take every nth person? | systematic | 11. What is a type of sample taken where you take the information in no particular order? | random | 12. # Guitars Sold 12 15 20 8 15 18 17 21 10 24 Find IQR of the following data. | 8 | 13. Explain the empirical rule. | 68%,95%,99% | 14. Triple the Points: The sample means for each shop are as follows: Shop 1: {21.25, 15.25, 25.0, 15.0, 14.0, 18.0, 12.25, 19.25, 22.0, 21.25}Shop 2: {17.5, 18.25, 8.0, 22.25, 7.75, 18.25, 24.0, 28.5, 16.0, 16.25}What shop should stay open based on this sample? Why? Find the standard deviation of each. | for the samples for Store 1, the mean is 18.325 and the corrected standard deviation is 4.11;for the samples for Store 2, the mean is 17.675 and the corrected standard deviation is 6.46 (Store 1) | 15. Define outlier. | Data that is away from the other data. (Two standard deviations) | 16. What is the population and sample of the following question? Survey PHS to figure out what types of phones teenagers are buying in 2012. | P-All Teenagers;S-PHS | 17. # Guitars Sold 12 15 20 8 15 18 17 21 10 24 Draw a box and whisker and stem and leaf for the information provided. | N/A | 18. Explain how the activity length of legs to jumping distance resulted in a linear regression. | Something concerning one thing depending on the other. We realized students who had longer legs tended to jump farther. |
![]()
Question 1 (of 18)
![]()
Question 2 (of 18)
![]()
Question 3 (of 18)
![]()
Question 4 (of 18)
![]()
Question 5 (of 18)
![]()
Question 6 (of 18)
![]()
Question 7 (of 18)
![]()
Question 8 (of 18)
![]()
Question 9 (of 18)
![]()
Question 10 (of 18)
![]()
Question 11 (of 18)
![]()
Question 12 (of 18)
![]()
Question 13 (of 18)
![]()
Question 14 (of 18)
![]()
Question 15 (of 18)
![]()
Question 16 (of 18)
![]()
Question 17 (of 18)
![]()
Question 18 (of 18)