

Overview
As well as being are a fantastically rich source of historical information, maps can provide the basis of some effective and interesting classroom activities. Here are a few ways I use them in my history classroom which are easily transferable to other topics and subjects.
1. Convert a narrative into a Google Earth Tour
Students can be provided with a timeline of key events, and challenged to plot these on a map or in Google Earth to give them a fresh perspective and gain some geographical awareness of the topic in question. Examples include:
Tsarist Russia on the Eve of World War One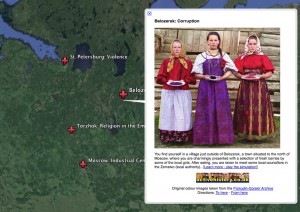
- This flyover highlights 16 key locations of relevance to students of Tsarist Russia on the eve of World War One. It is illustrated with original colour photographs from the Prokudin-Gorskii archives, organised around six groups of issues: political, economic, social, military and religious. The flyover also links to the interactive decision making game on this topic I have constructed for the benefit of students which will keep them busy for a double lesson or so!
Causes of World War Two
- This flyover, complete with a worksheet, is designed to teach students about the main events, but also to encourage them to reflect on the shifting pattern of international alliances.
2. Place one map inside another to stress scale of territory/impact
It is very easy for students to overlook the vast scale of a territory being studied, despite the fact that in some instances this provides a crucial means of understanding the process of change and continuity. In this sense, placing one feature inside another can provide a quick but effective means of illustrating scale. For example:
- Provide students with a map of their own country (e.g. Great Britain). Then provide students with a map of imperial Russia. Ask them to draw a rectangle inside it somewhere to indicate the size of Great Britain. Then, provide students with an actual scaled map of Britain. Is it smaller than expected (likely)? What challenges would this provide to a ruler? A simpler (but less effective) method entails providing a key to illustrate how many kilometres are represent per centimetre, but get the students to guess this first before telling them the correct figure.
- Provide students with a map of their own locality. Ask them to draw around this the borders of another region, city, battle-lines or event. Then they should compare this to the reality. For example, students could overlay a map showing the impact of the atomic bombs dropped on Japan onto their own locality to bring home the scale of destruction. This website allows you to chart the impact of the atomic bomb on your own city.
- Provide students with a map of the area in question. Then provide them with a ‘then and now’ overlay to demonstrate the scale of change or impact. For example, I use a Google Earth Tour from my World War One Battlefields page at ActiveHistory to zoom in on the area corresponding today to the Western Front. I ask them to anticipate where, and how many, allied graveyards can be found in this area. Then, I tick the box which reveals a folder of placemarks showing each cemetery as a small white cross. It is an absolute blizzard and generates an audible sharp intake of breath around the class. It’s a very simple, but profoundly moving, map-based starter activity.

3. Anticipate and research key features on a blank outline map at the start of the topic
Rather than providing students with a detailed map as a reference resource (which, more likely than not, will end up filed away and neglected), provide students with a blank outline map and challenge them to label key cities, sites and natural features using whatever sources they have available to them. This is particularly useful when the study of the topic will require frequent reference to particular regions and cities.
Approach 1: Anticipation-based
This phase is particularly useful if students have studied this place before. Provide students with a blank outline map and then ask them, from their existing knowledge and through their own powers of deduction, where they anticipate certain borders and places are located.
One of the most effective examples I use involves a study of the Spanish Civil War. Students are provided with a map illustrating the division between Republican and Nationalist zones at the start of the war in 1936. They are then asked where they anticipate that the Nationalists will focus on in terms of territory to be seized. I then reveal the next map which shows the progress of the Nationalist armies. The process is then repeated in a series of maps bringing us up to 1939. At the end of the exercise, we discuss what appears to be the essence of the Nationalist strategy (in particular, Franco aimed to divide Republican Spain down the middle, and to inch forward towards Madrid destroying resistance in a chillingly methodical manner):

Other examples:
- Here is a map of Europe in 1914. Draw a line to represent where you think the Western Front started and ended by Christmas 1914.
- Here is a map of Germany after World War One. Shade off the areas which you anticipate she will have to surrender to the allies based on your understanding of allied war objectives (TIP: think about Alsace Lorraine and the proposed Polish corridor).
- Here is a map of Austro-Hungary at the end of World War One with the national minorities highlighted. Divide the territory into new states (Hungary, Austria, Czechoslovakia, Yugoslavia…).
- Here is a map of Russia directly after the Russian Revolution. Label the Ural mountains and the Caucasus mountains. Draw the borders of Ukraine and Georgia and Siberia. Label St. Petersburg, Moscow, Archangel, Brest-Litovsk Vladivostok and the trans-Siberian railway.
- Here is a map of Russia in 1918. Shade off the area of territory which you anticipate was lost to the Germans in the Treaty of Brest-Litovsk (note: it is particularly interesting to compare the size of territory lost by the Russians to the Germans in World War One with the size of territory lost by the Germans to the allies – it provides an interesting rebuttal to the argument made by Germany that she was badly treated at Versailles in territorial terms).
- Here is a map of Germany after World War Two. Label the location of Berlin, then draw the anticipated borders of the French, British, Soviet and US zones of occupation based on what you know about the Soviet occupation and the debates at Yalta and Potsdam.
Approach 2: Research-based
This phase can follow directly from the anticipation exercise listed above, or can be form the main activity in itself. Students use whatever sources are available to complete their map correctly.
If they have completed Phase [1] they should start by comparing their maps with a partner and as a class (the teacher could even try to reach a class consensus on a final, whole-class map). Then, when they conduct their research to complete a master copy, they will be much more engaged in the process and willing to answer such questions as “Were the borders substantially larger or smaller than you expected?”.

If the topic is a new one, it is unlikely that Phase [1] will be worthwhile and so students could proceed straight to this task. For example, I start my study of the Spanish Civil War with a homework exercise in which students are challenged to label an outline map of the Iberian peninsula with key features, cities and regions (in particular, noting where separatist movements were particularly strong, and the north-south divide in terms of agriculture and industry). A particularly interesting feature is the central location of Madrid, which has no economic sense whatsoever: it was consciously built there by King Philip II precisely because it was situated centrally in the land mass.
The map of Spain can then be returned to at regular points in the unit to add further labelled features – in particular the location of some of the key battles.
4. Use classroom debate to decide upon the most appropriate / likely border changes partway through a topic
This technique is similar to the anticipation exercise outlined above, but lends itself particularly well to topics involving debate between different parties about the most appropriate border changes. Students are arranged into small teams, with each person representing a different interest group, and they are then challenged to agree upon the fairest possible division of territory. For example:
- Provide students with a map of Palestine after World War Two. Key geographical features should be labelled in terms of population distribution, water sources and fertile land. In teams of three (representing Arabs, Jews and the Western powers), students have to divide the territory into three areas (Palestine, Israel and International Zones) in a way which they think is most likely to bring lasting peace to the region. NOTE: The teacher should stress that they will cast a vote in favour of the best plan. Although students should aim to defend their interest group’s objectives, they should be aware that being too greedy will likely mean that their plan will be thrown out altogether.
- At the end of this particular exercise, students can compare their maps to the various proposals put forward both before and after World War Two by the British and by the UN and discuss the merits of each. [full materials for this unit are available on ActiveHistory here]
- Another topic which lends itself well to this approach are the negotiations at Versailles (1918) and Yalta/Potsdam (1944-45) about the future of Germany. If there is time, a ‘compare and contrast’ exercise based on Germany’s treatment after both World Wars is particularly valuable.
5. Plot the movement of individuals along a path
This approach is useful when charting the journey of a particular person over time. As an added challenge, students could be provided with a ‘jigsaw timeline’ and reconstruct it into the correct order by plotting the places mentioned on a map and thereby deducing the most likely order in which they happened. Google Earth is particularly effective for creating these ‘tours’, and I have created several Google Earth Tours on ActiveHistory. Possible topics might include:
- The Circumnavigation of Sir Francis Drake [available at ActiveHistory here]

- The “Long March” of Mao Zedong
- The voyages of Marco Polo
- The Invasion of Russia by Napoleon’s armies
- The journeys of Olaudah Equiano
- Medieval pilgrimage routes
6. Chart the expansion / contraction of an idea, an empire or a catastrophe
a. Empires
The growth and decline of the Roman (and British, Ottoman and other) Empires lends itself well to mapwork. Students should shade different territories in different colours to represent the different time periods that they were absorbed into the Empire. For added challenge:

- Provide students with a timeline listing when various territories were incorporated, but don’t label these on the map itself: instead, students have to identify where these territories are themselves before drawing the borders on the map and shading them in.
- Ensure that students are provided with follow-up questions to reflect upon so it doesn’t become a meaningless colouring-in exercise: for example “Which was the period of greatest expansion?”, “Can you find out who was Emperor at this time?”, “Why did the empire not expand any further?”, “What benefits and drawbacks would continued expansion bring?”
b. Diseases and Ideas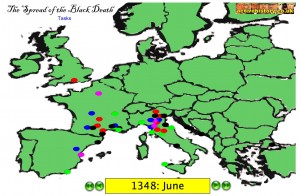
The spread of a pandemic as in The Black Death on ActiveHistory can be charted on a map very effectively. Data exists for the time when the disease was first and last recorded in various cities all over Europe, and plotting this information on a map in various colours to represent various dates is an enlightening exercise when trying to get students to appreciate the scale and speed of how the disease spread.
A similar approach can be adopted for more localised epidemics such as the 1830s Cholera Epidemic, for the spread of ideas like Martin Luther’s 95 Theses across Europe (surprisingly rapid!),
c. Crime – Geographic Profiling
Geographic profiling is an activity I use when studying Jack the Ripper at ActiveHistory. It is the name we give to the technique used by the police to work out where a killer might live. It is usually the case that
- The murders will be committed close to home (to allow a quick ‘return to base’) and
- The murders will take place increasingly close to home as the police step up their presence in the area.

With this in mind, I instruct students to plot the location of each murder on the map. Then, based on the information, students are asked to speculate where they think that the murderer is most likely to live and to shade this area on the map. Finally, we look at what the most recent ‘Ripperologists’ have concluded before discussing the limitations of this evidence.
Conclusions
These represent just a few methods I have used recently with my own students. I’d be very interested to hear if you can think of any other topics that they could be applied to, or any other methods you use in your own classroom – you can contact me on Twitter @russeltarr.